What if you could predict sales, optimize budgets, or uncover hidden trends hiding in your Excel sheets? Regression analysis makes it possible—and you don’t need a stats degree. Here’s how to perform regression analysis in Excel and transform numbers into actionable insights.
Why Perform Regression Analysis in Excel?
Regression analysis identifies relationships between variables, letting you forecast outcomes or test hypotheses. For example:
- Predict quarterly sales based on ad spend.
- Determine how temperature affects product demand.
- Analyze customer demographics against purchase behavior.
While tools like Python and R dominate advanced analytics, Excel’s accessibility makes it ideal for quick, impactful regression analysis in Excel.
Preparing Your Data for Regression Analysis
- Organize Variables:
- Independent variable(s) (X): Factors you control (e.g., marketing budget).
- Dependent variable (Y): Outcome you predict (e.g., sales).
- Arrange in columns (e.g., Column A = X, Column B = Y).
- Clean Data:
- Remove blanks, outliers, or errors using
FilterorGo To Special. - Check linearity with a scatter plot (
Insert > Scatter).
- Remove blanks, outliers, or errors using
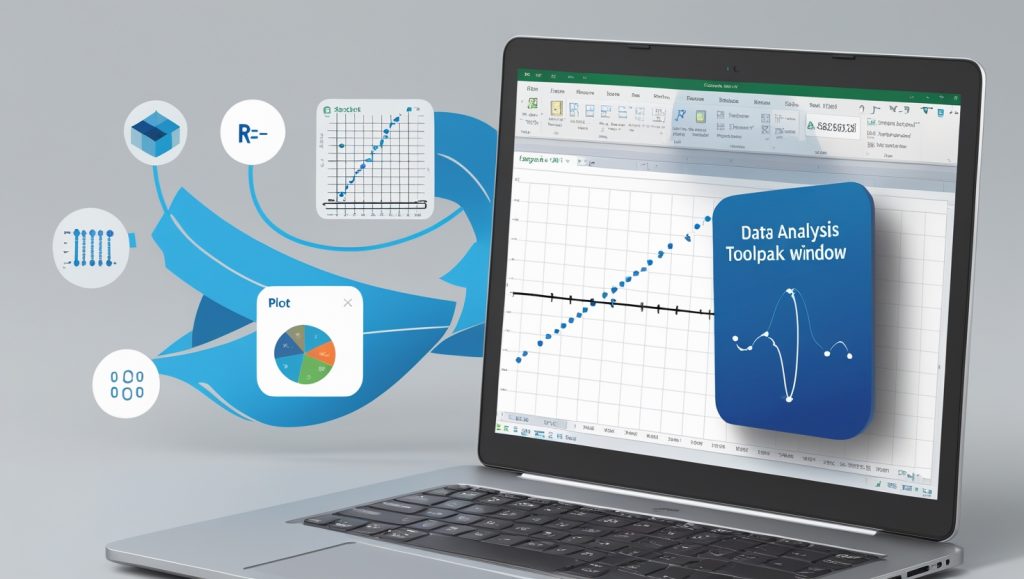
- Enable the Data Analysis Toolpak:
- Go to File > Options > Add-ins > Excel Add-ins > Analysis Toolpak.
How to Perform Regression Analysis in Excel: 3 Methods
Method 1: Using the Data Analysis Toolpak (Simple & Fast)
- Go to Data > Data Analysis > Regression.
- Input Y Range: Select dependent variable (e.g., BB2:BB100).
- Input X Range: Select independent variable(s) (e.g., AA2:AA100).
- Check Labels if headers are included.
- Choose output location and click OK.
Key Outputs to Interpret:
- R-squared: 0.8 means 80% of Y’s variation is explained by X.
- P-value: <0.05 indicates a statistically significant relationship.
- Coefficients: Y = Intercept + (Coefficient * X).
Method 2: LINEST Function (Dynamic Formulas)
Use =LINEST(known_y’s, known_x’s, const, stats) for advanced users:
- Const: TRUE/FALSE (include intercept or force through origin).
- Stats: TRUE returns additional metrics (R-squared, standard errors).
Method 3: Trendlines in Charts (Visual Learners)
- Create a scatter plot.
- Right-click data points > Add Trendline.
- Check Display Equation on Chart and R-squared.
Interpreting Results: What Your Regression Output Really Means
- R-squared: Closer to 1 = better fit.
- 0.6–0.8 = strong relationship in business contexts.
- P-value: <0.05 means the relationship isn’t random.
- Coefficients:
- Positive coefficient: X increases Y.
- Negative coefficient: X decreases Y.
Example: If the coefficient for ad spend is 2.5, every 1inadsdrives1inadsdrives2.50 in sales.
Common Pitfalls When You Perform Regression Analysis in Excel
- Multicollinearity: When X variables are correlated (e.g., ad spend and social posts). Use
Correlationtool to check. - Overfitting: Too many X variables inflate R-squared. Simplify the model.
- Non-Linear Relationships: If scatter plots curve, use polynomial regression.
Advanced Tips for Regression Analysis in Excel
- Multiple Regression: Add more X variables (e.g., ad spend + seasonality).
- Dummy Variables: Convert categories (e.g., Region: North = 1, South = 0).
- Residual Analysis: Check
Residual Outputfor patterns (random = good).
Real-World Example: Predicting Sales with Regression
Scenario: A retail chain wants to forecast Q4 sales based on historical ad spend.
- Data: 24 months of sales (Y) and ad spend (X).
- Regression Output:
- R-squared = 0.75
- P-value = 0.003
- Equation: Sales = $10,000 + (3.2 * Ad Spend)
- Insight: Every 1kinadsyields1kinadsyields3,200 in sales. Increase ad budget by 20% for Q4.
Your 5-Step Regression Checklist
- Clean and plot data for linearity.
- Enable Analysis Toolpak.
- Run regression and note R-squared/p-values.
- Validate residuals for randomness.
- Apply the equation to future scenarios.
Final Takeaway: Perform Regression Analysis in Excel to Make Smarter Decisions
Regression analysis isn’t just for data scientists. With Excel, you can uncover trends, predict outcomes, and justify business strategies—no coding required. Ready to turn your data into a crystal ball?
Also, Follow us @insightsica_ai on Instagram and blog for more update